Remote debugging with VSCode without Remote Development
This post is available in Russian here.
There’s a certain point in life in which you realize you need to debug a program that simply cannot be run on your working machine due to reasons. In my case I have to debug a program that communicates with iwd, the Intel wireless daemon for Linux. My workstation doesn’t have a Wi-Fi adapter, so I needed some sort of a remote debugging hack.
VSCode has a Remote Development addon specifically addressing such cases. However:
- Commit signing, if you have
GPG_TTYand auto-signing enabled, doesn’t seem to work, failing to sign commit data. - SSH agent, if not using agent forwarding, won’t allow you to add keys.
- Opening local folders, even though RD can do it, just doesn’t work for me.
I’m doing Go development, so the hack I am describing applies to Go when using Delve for debugging. Nonetheless, the approach doesn’t change much if your programming language’s of choice VSCode addon supports attaching to a remote debugger.
What we’re going to do basically sums up to this:
- Write a script that does the following:
- builds the binary with debugging support
- copies it to the target machine via SCP
- starts Delve in headless mode
- Add a VSCode debug profile that would attach to the target machine.
- Make VSCode autostart the script on starting a debugging session.
Scripting building and Delve
Delve, the Go debugger, supports running as a headless server for the clients to attach to. We need to run a binary remotely.
This can technically be achieved with a simple shell script, but I find using Task a lot more convenient than writing a script or a Makefile. Here’s what I came up with:
version: '2'

tasks:
  killall:
    cmds:
      # kills delve on a target machine, still succeeds if dlv's not running
      - ssh target_machine killall dlv || true
  push:
    deps:
      - killall
    cmds:
      # builds the program with optimizations disabled
      - go build -gcflags="all=-N -l" -o ./build/debug_binary ./cmd/program
      # copies the binary to the target machine
      - scp ./build/debug_binary target_machine:/home/tdemin/Desktop/debug_binary
  delve:
    deps:
      - push
    cmds:
      # starts dlv in headless mode listening on port 64001
      # the tmux hack is here, as dlv doesn't fork into background so ssh
      # won't stop and the debugging session won't start; nohup won't work here,
      # nor will the & operator
      # for this to work you'll ned tmux installed of course
      - ssh target_machine '(cd ~ && chmod +x Desktop/debug_binary && tmux new -d dlv --headless -l \[::\]:64001 exec ./Desktop/debug_binary)'
The entire sequence can now be started with task delve. The dependencies
ensure Delve is killed beforehand (scp won’t work if the program is still
running), and the binary is built and pushed to the target machine.
Configuring the debugging profile
Long story short, here’s how you configure .vscode/launch.json (assuming
the Go addon is installed):
{
    "version": "0.2.0",
    "configurations": [
        {
            "name": "Attach to target",
            // dlv uses API v1 by default, this is switchable with command line
            // flags at dlv startup
            "apiVersion": 1,
            "type": "go",
            "request": "attach",
            "mode": "remote",
            // appears to be mainly meaningless, dlv works just fine even if the
            // target doesn't have the source code for the program being
            // debugged
            "remotePath": "${workspaceFolder}",
            // dependency on our build task, the task will be described below
            "preLaunchTask": "Run Delve on target",
            "port": 64001,
            "host": "target_machine"
        }
    ]
}
Adding the pre-debug task
This is a matter of a single file as well, the .vscode/tasks.json:
{
    "version": "2.0.0",
    "tasks": [
        {
            // has to match with the contents of preLaunchTask in launch.json
            "label": "Run Delve on target",
            "type": "shell",
            // runs Taskfile with our script
            "command": "task delve",
            "group": {
                "kind": "test",
                "isDefault": true
            },
            "presentation": {
                // hides the terminal with repetitive build output
                "reveal": "silent"
            }
        }
    ]
}
Debugging
When done, you can now hit F5 and enter debug session.
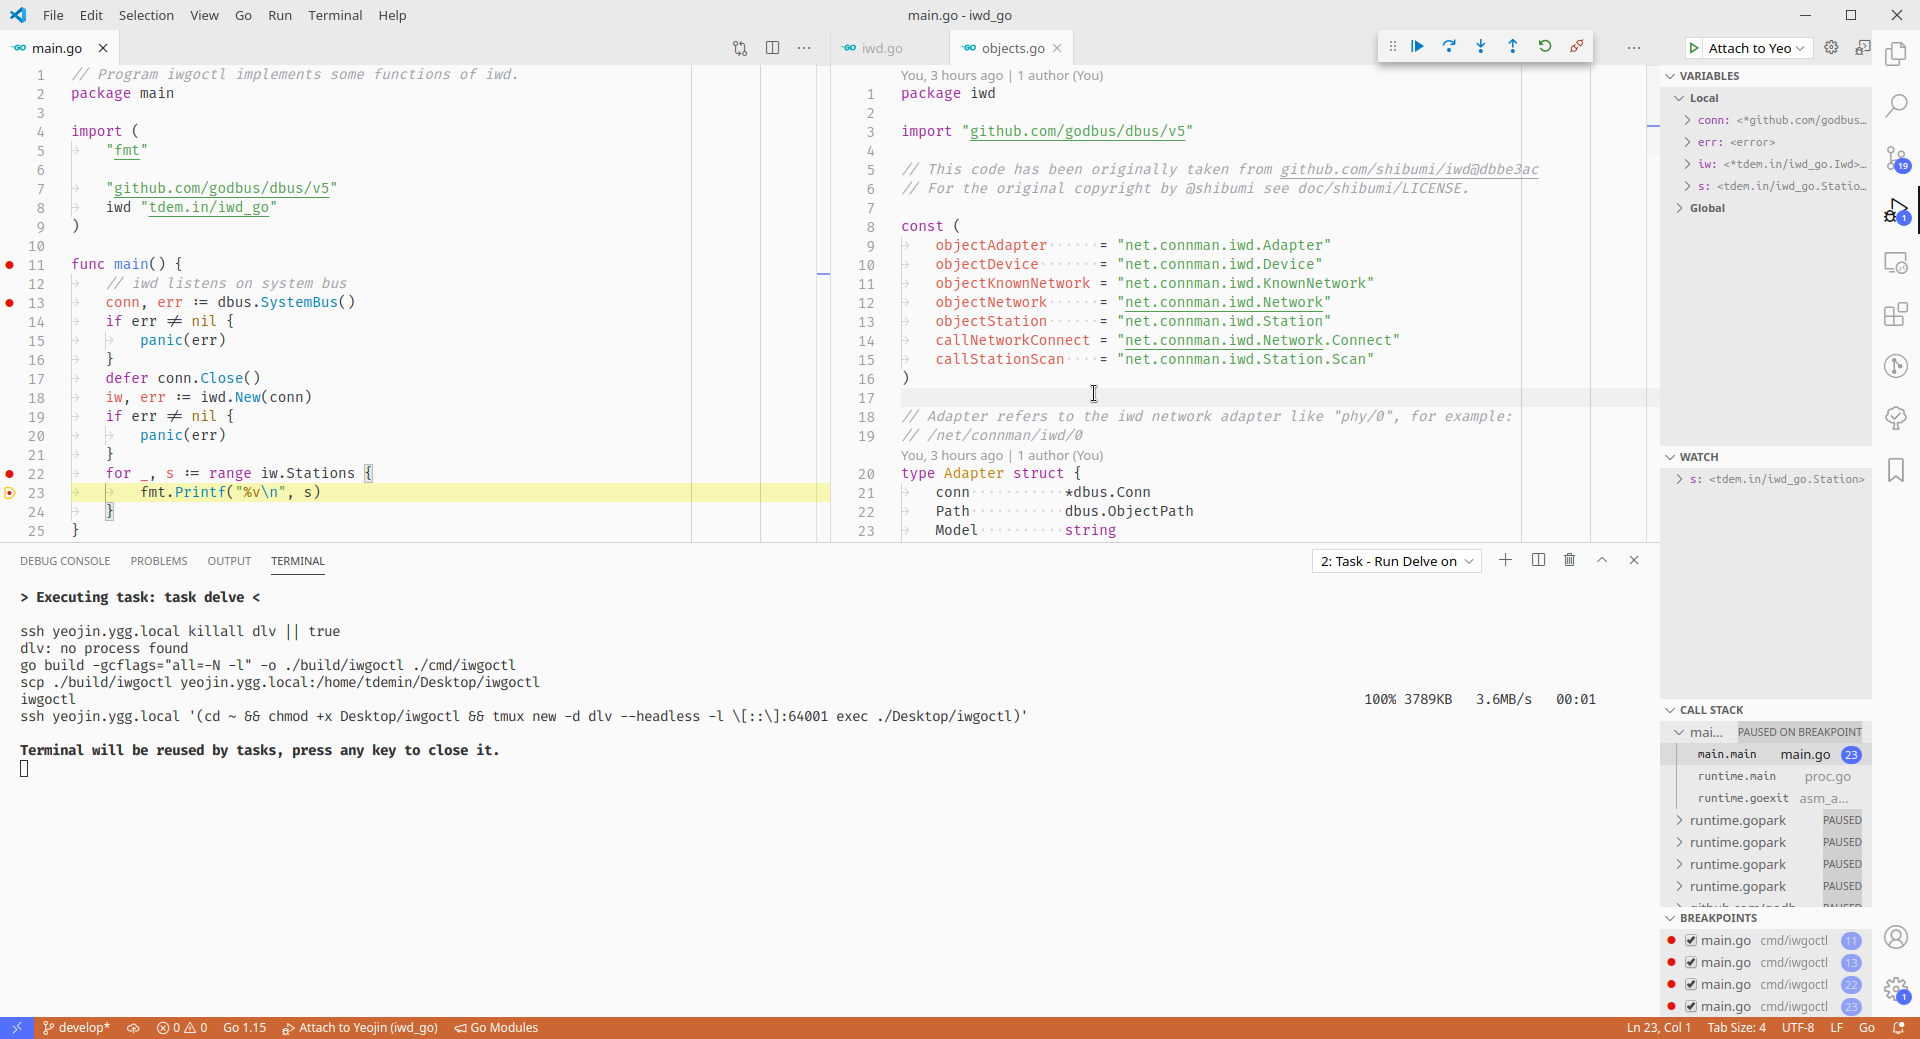 VSCode remote debug session
This works, but has a limitation: the debug console/internal terminal aren’t attached to program’s output. You can theoretically attach to the remote tmux session to see the program’s stdout, but it’s rather bothersome to do that every time.
Well, this works, so I hope this saves you time if VSCode’s Remote Development just doesn’t work for you.